
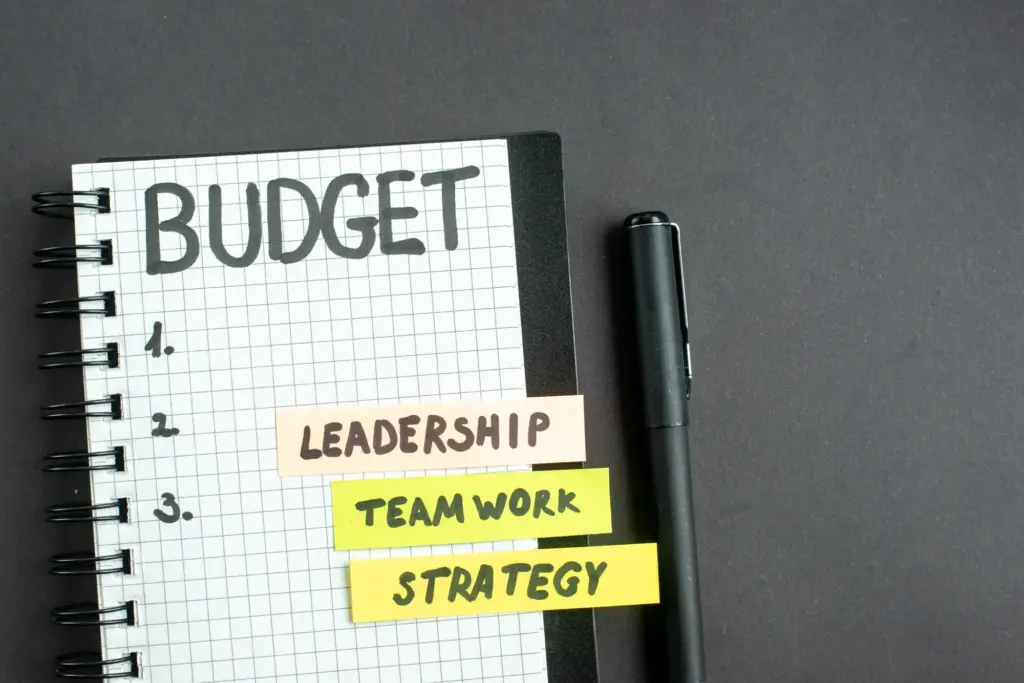
Make Prices Visible, Make Decisions Easy
Today we dive into Visual Pricing Strategy Frameworks for Independent Consultants, turning abstract numbers into clear, empathetic stories clients instantly understand. You will learn how to sketch value, anchor options responsibly, frame choices with integrity, and present proposals that travel inside organizations. Expect practical canvases, simple diagrams, and memorable metaphors you can apply this week. Bring a notebook, curiosity, and your latest proposal draft; by the end, you will redraw it with confidence and persuasive clarity.


Seeing Value: Designing Pricing Narratives That Click
Independent consultants win when clients can see value before seeing price. By sketching outcomes, milestones, and risk reduction beside each option, you transform hesitation into clarity. We’ll translate messy scoping notes into crisp visuals that align expectations, de-risk delivery, and make your premium feel reasonable. You’ll practice mapping benefits to price bands, contrasting alternatives, and labeling tiers with meaningful names, so conversations move from hourly discomfort to outcome confidence.
Anchors, Contrast, and Choice Architecture
Ethical Anchoring
Set a high anchor only when you can credibly deliver outsized outcomes or unusual certainty. On the page, pair the anchor with evidence panels: relevant case snapshots, quantified risk removal, and stakeholder testimonials linked to each claim. Make the anchor visually prominent but never manipulative, and clearly label optional extras. Clients respect ambition paired with transparency; they recoil from theatrics. When your anchor explains why it costs more, it stops being a shock and becomes a strategic option.
Contrast Panels
Create side-by-side cards that compare options on three axes: value realized, speed to first result, and risk profile. Replace abstract checklists with icons tied to business results, like clock markers for time-to-impact. Use neutral colors for comparability and a single accent to draw the eye to recommended balance. A data-savvy SEO consultant did this, and meetings shifted from line-item haggling to conversations about launch speed and certainty, where their expertise stood out naturally.
Risk–Reward Spectrum
Plot each option on a horizontal spectrum, left to right, from conservative to bold. Annotate risks you absorb, risks the client retains, and mitigations included. Draw the early warning signals you’ll monitor and the thresholds that trigger course corrections. When clients visualize uncertainty this way, they often choose balanced options with clear controls over cheaper paths that hide risk. Your price stops feeling like a gamble and starts reading as informed risk management, which executives appreciate.
Data-Backed Confidence Without Jargon

Capacity Heatmap
Map your weeks across a quarter, coloring capacity from cool to warm. Add labels for client milestones and your known immovables. When prospects see where their project fits, they understand why a rush fee exists or why a start date matters. This transparency deters frantic replanning, protects your margins, and reassures buyers that you track commitments like a pro. It also signals boundaries, which paradoxically increases confidence in your ability to deliver predictably.
Time-to-Value Timeline
Draw a simple timeline with three moments: first signal of value, first measurable win, and compounding effect. Annotate each with the artifact you’ll deliver and the metric that moves. By highlighting the earliest value moment, you reduce fear of long ramps. A product marketing consultant used this to secure prepayment because executives could finally see when the first sales enablement asset would land, making the investment feel near-term and tangible instead of distant and theoretical.
Sensitivity Sketches
Present what-if doodles that show how price changes with scope, constraints, or data access. Keep it hand-drawn or minimally styled to invite discussion rather than imply false precision. Mark safe zones, stretch zones, and red lines where quality breaks. When clients test scenarios with you in real time, they feel ownership of the final configuration. The resulting price becomes a shared conclusion, not a mysterious edict, and concessions become trade-offs both sides understand and respect.
Storyboards for Proposal Conversations
Transform proposals from static PDFs into storyboards that guide a decision meeting. Each frame advances the narrative: stakes, outcomes, approach, proof, options, commitments. Visual rhythm keeps energy focused while leaving room for discussion. By plotting questions you expect on specific frames, you avoid detours and prevent price from appearing before value. This structure helps your champion retell the story internally, faithfully and confidently, even when you are not in the room to defend details.

Opening Frame: Stakes and Outcomes
Start with a bold, uncluttered frame that articulates the business stakes in the client’s language. Pair a short problem statement with three outcome headlines and one simple graphic showing the opportunity gap. Invite the room to confirm, correct, or reprioritize. This early alignment earns permission to discuss price later. When stakeholders hear their words echoed back, resistance softens. You are no longer pitching; you are co-authoring the plan, and your fee becomes part of an agreed path.

Middle Frames: Evidence and Options
Sequence proof before options. Show abbreviated case vignettes mapped to the exact outcomes requested, then introduce two or three configurations with clearly labeled differences. Use quiet whitespace to slow the eye and callouts to explain trade-offs. Price enters only after approach and governance are clear. In this order, questions elevate from cost alone to feasibility and risk. The conversation becomes practical, adult, and constructive, setting up a final frame that invites an empowered, timely decision.

Closing Frame: Commitments and Next Steps
End with a commitments map: who does what by when, decision deadlines, kickoff artifacts, and a shared success dashboard. Show the signature path, procurement milestones, and the calendar weeks reserved for them. Add a small prompt for a pilot or pre-kickoff workshop, offering momentum without forcing a cliff jump. Close by asking one focused question: what would prevent us from starting on this date? This surfaces blockers now, not after price approval, saving everyone painful delays.
Artifacts That Travel Inside the Client Organization
Your contact will retell your proposal without you present. Equip them with portable visuals that summarize options, outcomes, price logic, and risk controls on a single page. Avoid jargon; write in their internal language. Provide a concise email-ready summary and a printable comparison that survives screenshots. When your artifacts travel well, committees align faster, procurement relaxes, and your champion looks brilliant. That goodwill accelerates signatures and turns negotiations into collaborative implementation planning, benefiting everyone involved.
Executive Brief Sheets
Craft a one-pager with four quadrants: why now, what changes, what it costs, and how we de-risk. Use numbers sparingly but meaningfully, and keep verbs active. Add a footnote with modeling assumptions so finance can verify quickly. Include your direct contact and a short bio line for credibility. Invite forwarding by design with a clean header that holds company logos if permitted. Executives prefer clarity over volume; give them exactly what helps them say yes responsibly.

Option Comparator Grids
Design a grid that pits your options against the status quo and any alternative the client is considering. Score on outcomes, time-to-value, total cost of delay, and resourcing strain. Use qualitative labels, then attach concise proof notes. This turns abstract debate into a grounded decision. When the status quo appears with its hidden costs, your price reframes from expense to investment. The grid also helps your champion neutralize internal pushback with dignified, evidence-backed comparisons.
Objection Handling Cards
Create small cards, digital or printable, each addressing a single predictable concern: price level, timeline, knowledge transfer, or vendor risk. Include a concise response, a relevant proof point, and a suggested next step. Keep tone calm and respectful. Clients appreciate preparedness, and your champion loves having words that land well in tense meetings. These cards reduce escalation, preserve momentum, and subtly display your professionalism, showing that you anticipate friction and have well-considered ways to resolve it.

Retainer Radar
Plot ongoing value across five spokes: strategic guidance, delivery velocity, stakeholder alignment, capability transfer, and risk monitoring. Shade the expected intensity per month and annotate review cadences. Add a small budget ring to indicate flexibility bands for ad hoc needs. This picture helps executives justify a stable monthly investment because they can point to continuous benefits, not vague access. It also anchors renewal discussions in observed outcomes, reducing awkwardness and preventing end-of-quarter scrambles for justification.

Milestone Ladders
Draw a ladder with rungs tied to tangible outcomes: brief signed, prototype tested, rollout complete, performance stabilized. Place payment tranches on rungs, not dates, making progress the trigger. Include acceptance criteria beside each rung to eliminate ambiguity. Clients love milestone clarity because it reduces arguments later, while you protect cash flow by agreeing on objective checkpoints. This simple ladder makes complex initiatives feel conquerable and gives both sides a shared heartbeat for momentum and accountability.

Bonus and Cap Dials
Represent performance incentives with two dials: upside bonus tied to specific metrics and a sensible cap that prevents runaway budgets. Label the measurement window, data sources, and review cadence. Show how partial attainment scales payout to avoid binary frustration. This transparency makes incentive models usable rather than mysterious. One analytics consultant adopted the dial diagram and finally closed a quarter-long negotiation in days, as finance could visualize exposure limits and the CEO could see precisely what success unlocked.
All Rights Reserved.